Business Intelligence Analyst Resume Example (2026)
By FindAJobAI team Updated How we built this page
Business intelligence analyst ads usually ask for SQL, a BI tool like Power BI or Tableau, some data warehouse exposure, and the ability to turn scattered reporting into something leadership trusts. What separates candidates is evidence that their dashboards became the source people actually used, replacing spreadsheets and conflicting numbers.
The example below is a BI analyst with five years at a regional grocery chain and a mid-size insurance company. Notice how each bullet names the data source, the audience and what decision or process the reporting changed, instead of counting dashboards delivered.
Business Intelligence Analyst resume template
This example as a one-page template: one column, standard headings and plain text, the format applicant tracking systems read most reliably.
After you sign up, Create my CV builds your own resume in this same one-column layout, from your real experience.
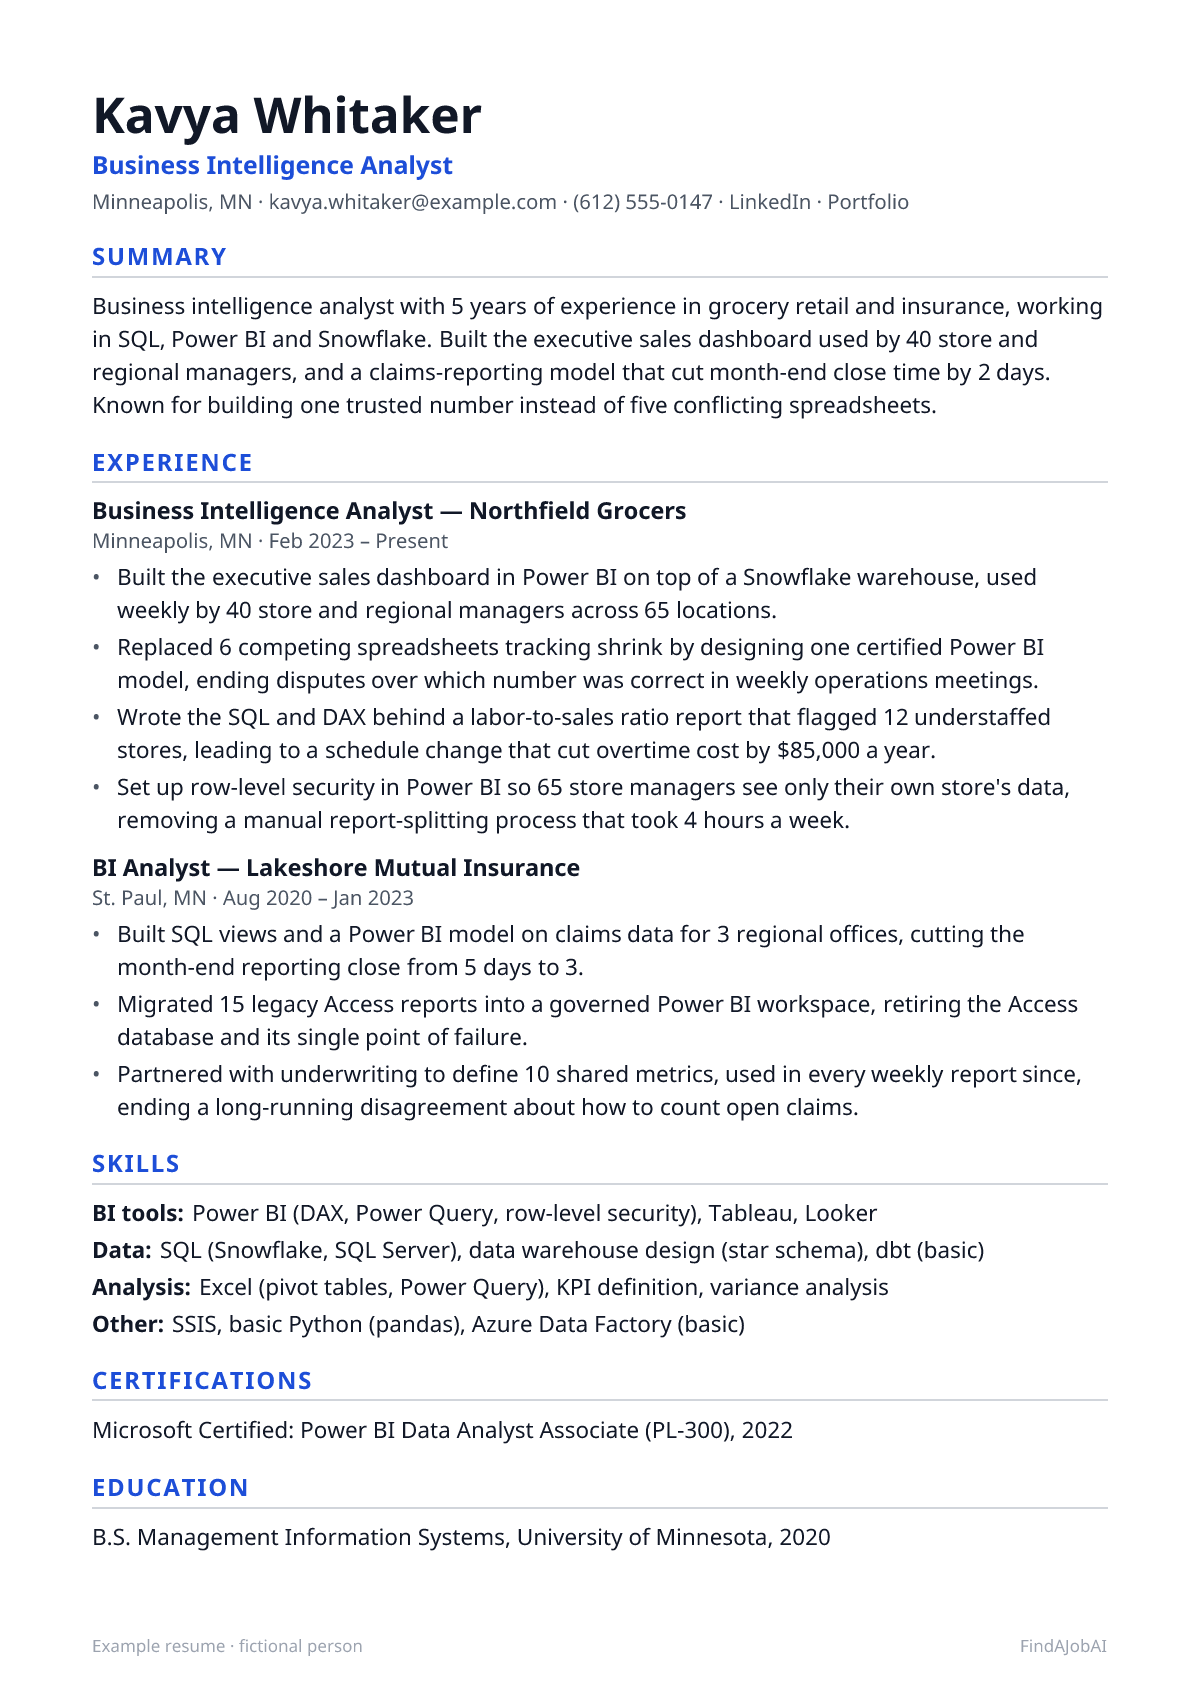
Mid-level business intelligence analyst resume example
A complete one-page example for a fictional business intelligence analyst: every bullet pairs an action with what changed because of it.
Example resume · fictional person
Kavya Whitaker
Business Intelligence Analyst
Minneapolis, MN · [email protected] · (612) 555-0147 · LinkedIn · Portfolio
Summary
Business intelligence analyst with 5 years of experience in grocery retail and insurance, working in SQL, Power BI and Snowflake. Built the executive sales dashboard used by 40 store and regional managers, and a claims-reporting model that cut month-end close time by 2 days. Known for building one trusted number instead of five conflicting spreadsheets.
Experience
Business Intelligence Analyst, Northfield Grocers
Minneapolis, MN · Feb 2023 – Present
- Built the executive sales dashboard in Power BI on top of a Snowflake warehouse, used weekly by 40 store and regional managers across 65 locations.
- Replaced 6 competing spreadsheets tracking shrink by designing one certified Power BI model, ending disputes over which number was correct in weekly operations meetings.
- Wrote the SQL and DAX behind a labor-to-sales ratio report that flagged 12 understaffed stores, leading to a schedule change that cut overtime cost by $85,000 a year.
- Set up row-level security in Power BI so 65 store managers see only their own store's data, removing a manual report-splitting process that took 4 hours a week.
BI Analyst, Lakeshore Mutual Insurance
St. Paul, MN · Aug 2020 – Jan 2023
- Built SQL views and a Power BI model on claims data for 3 regional offices, cutting the month-end reporting close from 5 days to 3.
- Migrated 15 legacy Access reports into a governed Power BI workspace, retiring the Access database and its single point of failure.
- Partnered with underwriting to define 10 shared metrics, used in every weekly report since, ending a long-running disagreement about how to count open claims.
Skills
- BI tools: Power BI (DAX, Power Query, row-level security), Tableau, Looker
- Data: SQL (Snowflake, SQL Server), data warehouse design (star schema), dbt (basic)
- Analysis: Excel (pivot tables, Power Query), KPI definition, variance analysis
- Other: SSIS, basic Python (pandas), Azure Data Factory (basic)
Certifications
- Microsoft Certified: Power BI Data Analyst Associate (PL-300), 2022
Education
- B.S. Management Information Systems, University of Minnesota, 2020
Fictional example by the FindAJobAI team: the person, employers and numbers are invented. Keep the structure; use your own work and numbers you can explain in an interview.
Entry-level business intelligence analyst resume example
A recent MIS graduate with one reporting internship and a capstone dashboard project. Education sits right under the summary, and the capstone project stands in for warehouse experience she hasn't had yet, stated with a finding rather than a tool list.
Entry-level example resume · fictional person
Hector Whitaker
Business Intelligence Analyst
Kansas City, MO · [email protected] · (816) 555-0129 · LinkedIn · Portfolio
Summary
Entry-level business intelligence analyst with a B.S. in Management Information Systems and a summer internship building SQL reports at a regional bank. Built a Power BI dashboard on public transit ridership data for a capstone project, identifying 3 declining routes from 2 years of ridership records. Comfortable in SQL and Power BI, looking for a first full-time BI role.
Education
- B.S. Management Information Systems, University of Missouri–Kansas City, 2025
Experience
BI Reporting Intern, Heartland Trust Bank
Kansas City, MO · Jun 2025 – Aug 2025
- Wrote SQL queries against a SQL Server database to build a weekly branch performance report used by 8 branch managers.
- Rebuilt a manual Excel loan-volume report in Power BI with a scheduled refresh, cutting a 2-hour weekly task to 10 minutes.
- Documented field definitions for 30 report columns in a shared glossary after finding 2 branches had been counting "active loans" differently.
Data Reporting Assistant, University of Missouri–Kansas City, Office of Finance
Kansas City, MO · Sep 2023 – May 2025
- Maintained 4 recurring Excel budget reports for department heads, using pivot tables and VLOOKUP to cut update time by half.
- Built a simple Power BI dashboard tracking departmental spending against budget, adopted by 2 department offices.
Skills
- BI tools: Power BI (DAX basics, Power Query), Tableau (coursework)
- Data: SQL (SQL Server, PostgreSQL), Excel (pivot tables, VLOOKUP)
- Other: Basic Python (pandas), data modeling fundamentals
Projects
- Transit ridership dashboard (Power BI, SQL): analyzed 2 years of public ridership data across 25 bus routes, identifying 3 routes with declining usage and one likely cause tied to a schedule change.
- Small business sales tracker (Power BI, Power Query): built a reporting template for a local coffee shop that replaced a paper ledger, used weekly by the owner to track top-selling items.
Senior business intelligence analyst resume example
A senior BI analyst ten years in, now leading a small reporting team. The bullets move from building dashboards to governing a platform used company-wide and justifying infrastructure decisions, and the summary names the team and the employee count her reporting reaches.
Senior example resume · fictional person
Sandra Okafor
Senior Business Intelligence Analyst
Atlanta, GA · [email protected] · (404) 555-0183 · LinkedIn
Summary
Senior business intelligence analyst with 10 years in logistics and manufacturing reporting, leading a team of 3 BI analysts. Owns the governed Power BI platform used by 500 employees across operations, finance and sales, and led a warehouse redesign that cut average report load time by 80%. Sets the standards for metric definitions and dashboard design company-wide.
Experience
Senior Business Intelligence Analyst, Peachline Freight Co.
Atlanta, GA · Jan 2021 – Present
- Lead a team of 3 BI analysts supporting operations, finance and sales reporting for 500 employees across 30 terminals.
- Led a redesign of the Snowflake warehouse's fact and dimension tables, cutting average Power BI report load time from 25 seconds to 5.
- Built a certified metrics catalog of 45 shared definitions, ending a long-standing disagreement between finance and operations over how "on-time delivery" was counted.
- Set data governance standards for row-level security and refresh schedules across 60 published Power BI reports, cutting data-access incidents reported to IT from 8 to 1 a quarter.
- Presented quarterly reporting roadmap to the COO, securing budget for a self-serve analytics rollout that cut ad hoc report requests to the team by 35%.
Business Intelligence Analyst, Coldwater Manufacturing
Macon, GA · Mar 2017 – Dec 2020
- Built the production-line dashboard used daily by 25 plant supervisors, surfacing a bottleneck that led to a line rebalancing saving $400,000 a year.
- Migrated 40 legacy Crystal Reports into Power BI, retiring an aging reporting server and its annual licensing cost.
- Trained 20 plant staff to use self-serve Power BI filters, cutting simple report requests to the BI team by a third.
Reporting Analyst, Dogwood Textiles
Macon, GA · Jun 2014 – Feb 2017
- Built monthly SQL and Excel reports on production yield for 3 plant managers, used to set weekly output targets.
- Cleaned and standardized product codes across 2 merged plant databases, resolving mismatches affecting 8,000 records.
Skills
- BI tools: Power BI (DAX, Power Query, row-level security), Tableau, Looker
- Data: Snowflake, SQL Server, dbt, star schema design, data governance
- Leadership: Hiring and coaching analysts, reporting roadmaps, executive presentations
Education
- B.S. Information Systems, Georgia State University, 2014
How to write a business intelligence analyst resume
Five steps, in the order a recruiter reads the page. The format around them stays plain for every job: one column, standard headings, newest role first.
Header: name, target title and links
Use the title “Business Intelligence Analyst” even if yours was Reporting Analyst or BI Developer, and name the warehouse and BI tool right in the headline or summary. Hiring managers search for both the title and the specific tool.
Summary: what you do and your best proof
Name your SQL and BI tool depth, the kind of business you report on, and one concrete result: a spreadsheet or conflicting report your dashboard replaced.
Experience: newest first, a result in every bullet
Open each bullet with the audience or the reporting problem, then the tool and the result: who uses the dashboard, what manual process it replaced, and what changed. Counting dashboards built says little; one spreadsheet retired or one metric dispute ended says a lot.
Skills: grouped, in the ad's words
Group into BI tools, databases and warehouses, spreadsheet skills and ETL or data modeling. Name the specific warehouse (Snowflake, SQL Server, Redshift) next to SQL, since many BI postings screen for a particular one.
Education and certifications
List your degree with the year, plus a certificate such as PL-300 or a Tableau certification if you hold one. Without BI work experience, add a Projects section with one or two dashboards built on public data, each naming the audience and a finding.
Skills to put on a business intelligence analyst resume
Hard skills are the tools and methods of the job; soft skills are how you work with people. Each comes with one way to prove it, because a skill named only in a list counts for little. Add the ones you really have.
Hard skills
- SQL
- Name the database or warehouse you queried and show a join or aggregation behind a specific report.
- Power BI
- Mention DAX measures or Power Query transforms you wrote and the manual report or spreadsheet they replaced.
- Tableau
- Say who opens your workbook, how often, and one decision or number it surfaced.
- Data warehouse concepts (star schema)
- Describe a table structure you built or improved and the query time or reporting benefit it produced.
- DAX
- Give an example measure you wrote (running total, year-over-year) and what it let users see that they couldn't before.
- Power Query / ETL
- Point to a manual data-prep process you automated, with the time it used to take.
- Data governance
- Describe a metric definition or access control standard you set and how many reports or teams it covered.
- Row-level security
- Name the number of users or roles it applied to and the manual process it replaced.
- KPI definition
- Show a metric you defined with other teams and the disagreement it ended.
- Python (pandas)
- Point to data cleaning or automation you did with it and the row count or hours saved.
Soft skills
- Stakeholder alignment
- Show a metric or definition you agreed across teams, naming the teams and what had been in dispute.
- Translating numbers for non-technical teams
- Describe simplifying a report for an executive or frontline audience and what it let them act on.
- Prioritization
- Give your monthly request volume and how you decided which reports came first.
- Attention to detail
- Mention an error or broken refresh you caught before it reached a leadership meeting.
- Ownership of a reporting platform
- Describe a governance standard or review process you introduced and its effect on error rates or requests.
- Teaching
- Count the colleagues you trained to use self-serve dashboards or filters.
Business Intelligence Analyst resume bullet examples: weak vs strong
The same work, written two ways. The strong version names the tool, the scope and a result; the numbers are examples, yours must be real.
Weak: Built BI dashboards.
Strong: Built a Power BI dashboard on warehouse inventory that 18 category managers check each morning, which surfaced $140,000 in slow-moving stock in its first quarter.
Names the audience, the frequency and a dollar figure the dashboard surfaced.
Weak: Managed the data warehouse.
Strong: Redesigned 4 fact tables in the Snowflake warehouse from a flat structure to a star schema, cutting average report query time from 40 seconds to 6.
Gives the specific change and a measured performance result.
Weak: Created reports for management.
Strong: Replaced a 20-tab executive spreadsheet with a 3-page Power BI report refreshed nightly, cutting the CFO's monthly prep time from 6 hours to 30 minutes.
Shows the before-and-after and whose time it saved.
Weak: Worked with stakeholders to define metrics.
Strong: Led sessions with finance and operations to agree on one definition of "on-time delivery," ending a dispute between 2 teams that had reported different numbers for a year.
Specific conflict resolved, with the teams and duration named.
Weak: Improved reporting efficiency.
Strong: Automated a weekly vendor scorecard with Power Query and scheduled refresh, cutting a 3-hour manual process to zero touch.
States the manual process and the time it used to take.
15 more business intelligence analyst resume bullet examples
Grouped by area of the job, so you can find the ones closest to your work. Keep the shape (action, scope, result) and replace the invented numbers with your own.
Dashboards and executive reporting
- Built an executive scorecard in Power BI tracking 15 KPIs across sales, operations and finance, replacing a 20-tab spreadsheet rebuilt by hand each month.
- Simplified a cluttered 12-visual sales dashboard down to 5 key visuals after reviewing usage logs, raising weekly active users from 30 to 85.
- Built a mobile-friendly Power BI report for 40 field managers who previously had no reporting access away from a desktop.
- Added drill-through pages to a regional performance report, cutting the number of custom one-off report requests by half.
Data warehouse and modeling
- Redesigned a flat sales table into a star schema with 4 dimension tables, cutting average dashboard refresh time from 20 minutes to 3.
- Built incremental refresh on a 50-million-row fact table in Power BI, cutting nightly refresh time from 3 hours to 25 minutes.
- Documented 80 fields across 6 core tables in a data dictionary, cutting new analyst onboarding time from 2 weeks to 4 days.
- Partnered with the data engineering team to add 3 missing dimension tables, eliminating a recurring manual join that broke twice a quarter.
Governance and data quality
- Set up automated null and row-count checks on 25 scheduled Power BI datasets, catching 10 broken source connections before numbers reached stakeholders.
- Standardized date and currency formatting across 30 published reports, ending a recurring complaint from the finance team about inconsistent totals.
- Led a metric certification review that reduced the number of "active customer" definitions in use from 4 to 1 across the company.
- Rolled out a report request intake form with priority tiers, cutting the average turnaround on urgent requests from 2 weeks to 3 days.
Training and adoption
- Trained 35 managers across 3 departments to build their own filtered views in Power BI, cutting simple requests to the BI team by 40%.
- Ran a lunch-and-learn series on reading the new executive dashboard, after which support tickets about the dashboard dropped to near zero.
- Created a 1-page quick reference guide for the top 10 reports, cutting basic "how do I find" questions to the help desk by half.
Business Intelligence Analyst resume summary examples
Two or three lines on what you do and your strongest proof. Start from the one closest to your level and use your own facts.
Business intelligence analyst with a management information systems degree and an internship building SQL reports at a regional bank. Built a Power BI dashboard on public transit ridership data for a capstone project, identifying 3 routes with declining usage. Strong in SQL and Power BI, looking for a first full-time BI role.
Business intelligence analyst with 4 years in healthcare operations, working in SQL, Power BI and a Snowflake warehouse. Built the staffing and patient-volume dashboards used by 15 clinic managers and a reporting model that cut month-end close by 2 days.
Senior business intelligence analyst with 10 years building enterprise reporting for a logistics company, now leading a team of 3 BI analysts. Owns the governed Power BI platform behind reporting for 500 employees and a warehouse redesign that cut average report load time by 80%.
Common business intelligence analyst resume mistakes
Each one is easy to make and quick to fix before you apply.
Counting dashboards instead of what they replaced
"Built 25 dashboards" doesn't say whether anyone used them. Name the audience and the spreadsheet, report or disagreement a dashboard replaced.
Treating Power BI and Tableau as interchangeable keywords
Listing every BI tool you've touched without depth looks like keyword stuffing. Lead with the one you have real depth in and show DAX, Power Query or calculated-field work in a bullet.
No mention of the underlying data source
A dashboard is only as good as what feeds it. Name the warehouse or database behind your reports, since many BI postings specifically ask for experience with one.
Skipping data governance or quality work
Senior BI postings often care about consistent metric definitions and trustworthy numbers as much as dashboard design. If you've resolved a metric disagreement or added data quality checks, say so explicitly.
ATS tips for a business intelligence analyst resume
Applicant tracking systems turn your file into text that recruiters search, mostly for the skills and titles in the ad. They rarely reject a resume on their own; one that parses badly or misses the ad's words just doesn't come up.
- Name the warehouse or database you built on (Snowflake, SQL Server, Redshift); BI ads usually ask for one specifically.
- Describe dashboards by who uses them, how often, and the spreadsheet or conflicting report they replaced.
- Mention DAX or Power Query depth if you know Power BI; "Power BI" alone doesn't show whether you can write a measure.
- Include a certification like PL-300 or a Tableau certificate if you have one; it's a quick signal for ATS keyword matches.
For the format itself, run the free ATS resume checklist.
Everything for Business Intelligence Analysts
- Business Intelligence Analyst cover letter examplesThree example letters and a short email version
- Business Intelligence Analyst interview questions30 questions with sample answers
- Business Intelligence Analyst job descriptionDuties, skills and requirements
- How to tailor your resume without lying
Other resume examples
Business Intelligence Analyst resume FAQ
What is the difference between a business intelligence analyst and a data analyst?
The titles overlap a lot. BI analyst postings tend to focus more on dashboards, data warehouses and recurring enterprise reporting, while data analyst postings often include more one-off analysis and statistics. Match your bullets to whichever the posting emphasizes.
Do I need to know data warehousing to be a BI analyst?
Some exposure helps: understanding star schemas, fact and dimension tables, or at least how your BI tool connects to a warehouse. You don't need to design warehouses from scratch unless the posting specifically asks for that.
Which BI tool should I list if I know several?
List the ones you've used in real work, but lead your experience bullets with whichever one matches the posting; many companies standardize on one tool and screen for it by name.
How we built this page
The FindAJobAI team wrote the three example resumes, the bullets, the skills and the advice for business intelligence analyst roles. The people, employers and numbers in the examples are invented; the structure, the tools and the way each bullet is built are the parts to copy.
Once we track enough live business intelligence analyst job ads, this page also shows the skills they ask for most, counted the same way as our in-demand skills report.
Last reviewed on November 1, 2026.